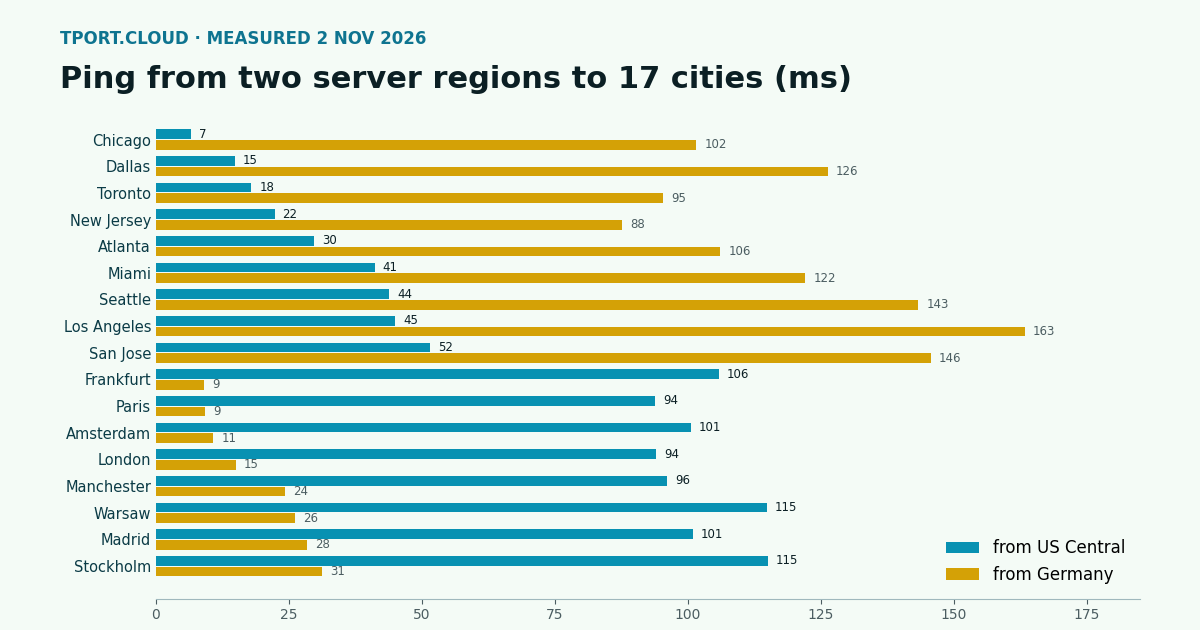
Most advice on picking a server region stops at "choose one close to your users". Close is a number, though, and it decides whether the region question matters for your app at all. So we measured it: on 2 November 2026 we pinged 17 cities in North America and Europe from our own US Central and Germany servers, then added two weeks of hourly city-pair data for the places we don't sit in.
Short version: from US Central, every North American city we tested was within 52 ms; from Germany, every European city was within 31 ms. Crossing the Atlantic costs about 94 to 115 ms from US Central to Europe, and 88 to 163 ms from Germany to North America. A first HTTPS request across the Atlantic took 361 ms in our test. If nearly all your users are on one continent, take the middle of that continent. If they are on both, the tables further down show what each location costs whom.
How we measured
From each server we sent 60 ICMP pings, 0.2 seconds apart, to Vultr's public ping hosts in 17 cities, in 4 rounds about 20 minutes apart between 00:55 and 02:00 UTC. The numbers below are the median of each round's average round-trip time. Ping targets sit in data centres, so these are server-to-server times: a real visitor's home or mobile connection comes on top.
For pairs we can't ping from, we used WonderNetwork's public ping history: 336 hourly runs per pair from 18 October to 2 November 2026. Our four rounds cover about an hour; theirs show how a route behaves over two weeks, including bad hours. Mixing two sources means small differences between tables aren't meaningful; differences of tens of milliseconds are.
From US Central and Germany to 17 cities
| City | From US Central (ms) | From Germany (ms) |
|---|---|---|
| Chicago | 6.6 | 101.6 |
| Dallas | 14.8 | 126.3 |
| Toronto | 17.9 | 95.4 |
| New Jersey | 22.3 | 87.7 |
| Atlanta | 29.7 | 106.1 |
| Miami | 41.1 | 122.1 |
| Seattle | 43.8 | 143.3 |
| Los Angeles | 45.0 | 163.3 |
| San Jose | 51.6 | 145.7 |
| Frankfurt | 105.8 | 9.1 |
| Paris | 93.8 | 9.3 |
| Amsterdam | 100.6 | 10.8 |
| London | 94.0 | 15.0 |
| Manchester | 96.1 | 24.2 |
| Warsaw | 114.8 | 26.1 |
| Madrid | 100.9 | 28.4 |
| Stockholm | 115.0 | 31.2 |
US Central works as a single location for North America: Chicago is 7 ms away, New Jersey 22, Los Angeles 45 and San Jose 52. Germany does the same for Europe, with Frankfurt at 9 ms, London at 15 and Stockholm at 31.
Two things in the raw data are worth saying. Rounds from US Central were very steady, with a spread inside each round (ping's mdev) of about 0.1 ms; from Germany it was mostly 1 to 7 ms, and about 11 ms on the Chicago route. And in the first round from Germany the Warsaw target lost 50% of its packets with a 395 ms average, then came back to about 26 ms for the other three rounds. Packet loss otherwise stayed at 3.3% or less in any round. One bad round on one route is normal internet weather, which is why we report medians and why one ping test on one afternoon proves little.
US to Europe, city by city
Median of the hourly averages, with the worst hourly average in those two weeks in brackets:
| US city | To London | To Frankfurt |
|---|---|---|
| New York | 70 ms (72) | 86 ms (95) |
| Chicago | 92 ms (96) | 107 ms (110) |
| Dallas | 103 ms (242) | 129 ms (324) |
| Miami | 101 ms (116) | 121 ms (152) |
| Seattle | 126 ms (130) | 138 ms (153) |
| Los Angeles | 125 ms (132) | 142 ms (235) |
| San Francisco | 134 ms (224) | 156 ms (163) |
The East Coast is the shortcut: New York to London is 70 ms, against 125 from Los Angeles. Medians hide route trouble, though. Dallas to Frankfurt has a median of 129 ms, but at least 5% of its hours averaged 210 ms or more.
Inside the US and inside Europe
| US pair | Median (worst hour) |
|---|---|
| New York to Chicago | 18 ms (20) |
| Chicago to Dallas | 23 ms (58) |
| Los Angeles to San Francisco | 10 ms (44) |
| Los Angeles to Seattle | 26 ms (54) |
| New York to Miami | 35 ms (61) |
| New York to Dallas | 37 ms (43) |
| Chicago to Los Angeles | 52 ms (55) |
| New York to Seattle | 62 ms (64) |
| New York to Los Angeles | 66 ms (171) |
| European pair | Median (worst hour) |
|---|---|
| London to Paris | 8 ms (10) |
| London to Amsterdam | 8 ms (14) |
| Frankfurt to Amsterdam | 11 ms (17) |
| Frankfurt to Paris | 15 ms (22) |
| Paris to Madrid | 16 ms (25) |
| London to Frankfurt | 17 ms (22) |
| Frankfurt to Milan | 18 ms (30) |
| Amsterdam to Warsaw | 22 ms (25) |
| Frankfurt to Warsaw | 24 ms (28) |
| London to Stockholm | 26 ms (30) |
| Frankfurt to Madrid | 28 ms (54) |
| London to Madrid | 30 ms (214) |
| Frankfurt to Stockholm | 33 ms (37) |
The coast-to-coast figure explains why the middle wins. A New York server is 66 ms from Los Angeles; a US Central server was at most 52 ms from anywhere we tested on the continent. Inside Europe, no median in this table passes 33 ms.
Why these numbers can't be tuned away
Light in optical fibre covers about 200 km per millisecond (the usual rule of thumb), so 1,000 km of straight path can't round-trip in less than about 10 ms. New York to London is about 5,570 km in a straight line: a floor of about 56 ms, against 70 measured. New York to Frankfurt, about 6,200 km: floor 62 ms, measured 86. Short routes run further over the floor, since cables don't run straight: London to Frankfurt is about 640 km, floor 6 ms, measured 17. No plan, CPU or tuning option changes this. Only moving the server, or caching content near the visitor, does.
What the milliseconds cost you
A ping is one round trip; real work takes several. We timed fetching a small file over HTTPS with curl, 12 samples per line, each on a new connection:
| Client to server | Median total | Range |
|---|---|---|
| Germany to US Central | 361 ms | 333 to 577 ms |
| US Central to Germany | 361 ms | 334 to 751 ms |
| Same machine, US Central | 14 ms | 10 to 33 ms |
| Same machine, Germany | 54 ms | 33 to 266 ms |
A typical cross-Atlantic request split as: TCP connected at 110 ms, TLS finished at 225 ms, first byte at 340 ms. That is three round trips: TCP, the one-round-trip TLS 1.3 handshake, then the request itself. The same-machine lines show what's left without distance: the TLS work and the server's own time. The rule that follows: first response on a new connection = about 3 x ping + server time. Requests on an open connection cost one round trip.
| Ping | Example | First response (3 x ping) | 20 calls one after another (20 x ping) |
|---|---|---|---|
| 10 ms | Germany to Amsterdam | 30 ms | 0.2 s |
| 45 ms | US Central to Los Angeles | 135 ms | 0.9 s |
| 94 ms | US Central to London | 282 ms | 1.9 s |
| 163 ms | Germany to Los Angeles | 489 ms | 3.3 s |
The last column is the one that hurts, and it is mostly self-inflicted. A page that makes 20 database queries one after another, with the database in another region, waits 20 round trips before it sends anything: 1.9 seconds at 94 ms. Keep your app and its database in the same region, whatever else you decide. That matters more than which region you choose. The same sum is why far-away single-page apps feel slow: batch the API calls, or put more into each response.
So which region?
Worst ping for each server location, using the tables above. US Central and Germany are our own figures across 17 cities; New York and London are WonderNetwork medians for the pairs listed, so they cover fewer cities:
| Server in | Worst in North America | Worst in Europe |
|---|---|---|
| US Central | San Jose, 52 ms | Stockholm, 115 ms |
| New York | Los Angeles, 66 ms | Frankfurt, 86 ms |
| Germany | Los Angeles, 163 ms | Stockholm, 31 ms |
| London | San Francisco, 134 ms | Madrid, 30 ms |
| Your users | Pick | Why |
|---|---|---|
| Mostly US and Canada | US Central | At most 52 ms to every city we tested |
| Mostly Europe | Germany | At most 31 ms to every city we tested |
| US East Coast and Europe | US East | New York is 70 to 86 ms from Europe and 18 from Chicago; the West Coast pays 66 |
| Whole US and all of Europe, interactive app | Two servers, or one plus a CDN for static files | One region leaves one continent at 3 x 100 ms or more per new connection |
| Background jobs, internal tools, APIs called by servers | The cheapest region | Nobody is waiting; ping only matters next to what the job talks to |
Before moving anything, check where your users really are (your analytics will say), then test from there. A few milliseconds of difference between two regions won't show on a normal page; 100 ms repeated across 20 calls will.
Test it yourself
Run them at a few different times of day and from the place your users are, not from your server. If tcp is low and first byte is high, distance isn't your problem: the app is.
Where this lands on tport.cloud
Our small sizes run in Germany, US Central and India, and bigger servers in 9 regions including US East, US West and the UK; every order lets you choose. The $1 server (0.5 vCPU, 512 MB, free for 30 days) is an easy way to run the commands above from a real region before you commit. For sizing the box once you've picked the place, see how much RAM a small web app really needs, and for what it costs next to a Droplet, the price comparison.
Sources
Our own measurements, 2 November 2026 (ICMP ping and curl from our US Central and Germany servers; ping targets are Vultr's public hosts such as nj-us-ping.vultr.com and fra-de-ping.vultr.com). City pairs: WonderNetwork ping history, 18 October to 2 November 2026, read 2 November. Fibre speed: NANOG thread on propagation delay. TLS 1.3 handshake: RFC 8446. Straight-line distances are our own great-circle sums, rounded. tport.cloud regions and prices from tport.cloud/pricing, 2 November 2026.
Pick your region and start with the $1 server, free for 30 days. Traffic included, prepaid, no surprise bills.
See servers and regions