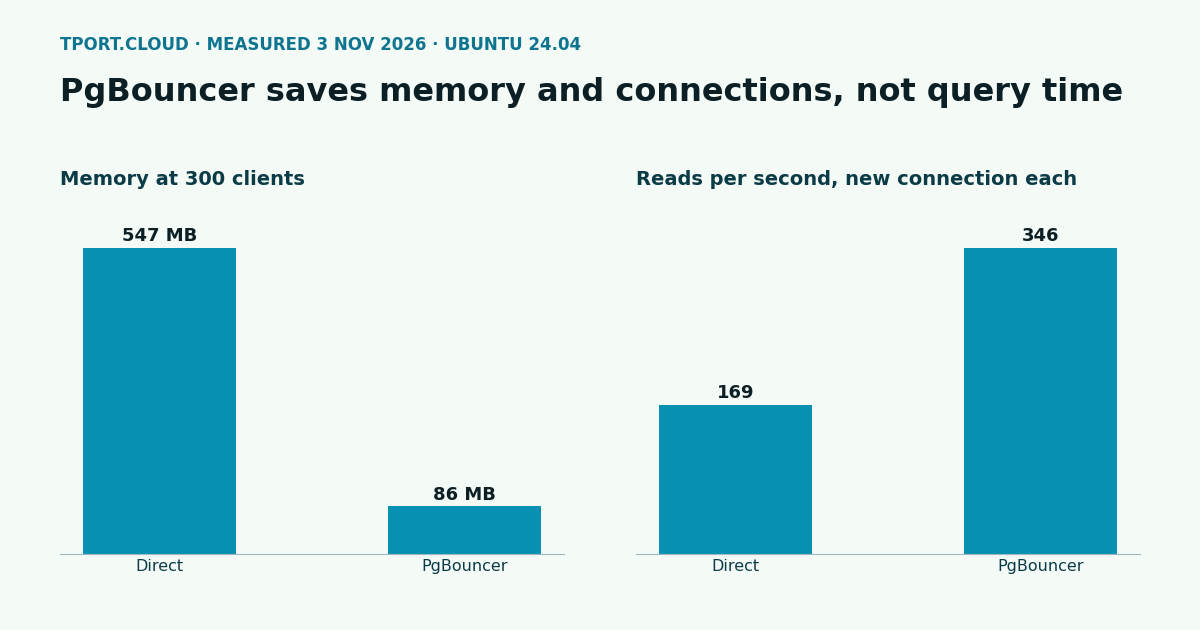
PgBouncer takes 10 seconds to install and about 10 MB of memory. With 300 clients connected, PostgreSQL and PgBouncer together used 86 MB, against 547 MB for PostgreSQL alone. Apps that open a new connection for each transaction got twice the throughput. What it won't do is make queries faster: with 20 clients it made no difference to reads and cost us 18% on writes.
It also changes how your app's connections behave. In transaction mode, several features quietly break, and we show each one below. We ran everything on 3 November 2026, on a clean Ubuntu 24.04 server with 2 vCPU and 4 GB of memory, using PostgreSQL 18.6 set up as in our PostgreSQL guide and PgBouncer 1.26.1.
Do you need it?
| Your app | PgBouncer? |
|---|---|
| One server process with its own small pool | No. Your pool already does this job |
| Many processes, or serverless functions, each with its own connections | Yes. This is its main use |
| Opens a new connection for each request | Yes, though fixing the app is better |
Needs more than max_connections (100 by default) | Yes, before you raise that number |
Step 1: install
If you added the PostgreSQL repository from our other guide, this gets you the current version. The service starts by itself.
Step 2: passwords
PgBouncer checks the password itself, then logs in to PostgreSQL. Give it the role's stored SCRAM hash, not the password, and keep the file private:
Step 3: configure a transaction pool
Replace the whole of /etc/pgbouncer/pgbouncer.ini. This listens on localhost only, for an app on the same server:
Point your app at port 6432 instead of 5432. Run migrations and anything that needs a real session on 5432 directly.
Step 4: what breaks in transaction mode
PgBouncer gives a client a server connection for one transaction only. The next transaction may land on another one, and that one may have been left in a state by someone else. A casual test won't show this, as our first attempt proved: one client alone keeps getting the same connection, so everything looked fine. To force it, we used a pool of 2 and had a second session hold the connection the first had just used:
| What session A did | Direct to PostgreSQL | Through PgBouncer |
|---|---|---|
set statement_timeout='5s', then show it | 5s | 0: the setting is gone. And session B now shows 5s: it got A's setting |
create temp table t1, then read it | Works | ERROR: relation "t1" does not exist |
select pg_advisory_lock(42), then B tries the same lock | B is refused | B gets it too, and A's unlock says you don't own a lock |
listen ch1, then C sends a notify | A receives it | A doesn't. B got it, and B never asked |
prepare p1, then execute p1 | Works | ERROR: prepared statement "p1" does not exist |
begin; set local work_mem='1MB'; ...; commit | Works | Works. Use this form for settings |
set application_name='mine' | Works | Works, because PgBouncer tracks this one |
The leak of statement_timeout is the dangerous one, as nothing reports an error: another client's queries just start getting cancelled at 5 seconds. Set per-role defaults with alter role, use set local inside a transaction, and keep advisory locks and LISTEN on a direct connection.
Prepared statements from drivers
Most drivers prepare statements at the protocol level, and that's what max_prepared_statements handles. Here's pgbench -M prepared, with 20 clients on a pool of 2:
That setting only covers protocol-level statements. The SQL PREPARE in the table above still fails.
Step 5: when a password changes
userlist.txt is a copy, so it goes stale. This is what happened after alter role app password:
| Attempt | Result |
|---|---|
| New password, file not updated | FATAL: SASL authentication failed |
| Old password, file not updated | Still let in, because PgBouncer checks its own copy |
| Old password, file not updated, after PgBouncer restarts | FATAL: password authentication failed, because its copy can no longer log in to PostgreSQL |
New password, after updating the file and systemctl reload pgbouncer | Works |
| Old password, after that | Refused |
So a stale file can look fine for days, then fail everyone at the next restart. A password change has to include rerunning step 2 and systemctl reload pgbouncer. Use the reload rather than the admin console for this, as the console login fails too if you changed the role in admin_users, which happened to us. PgBouncer can also look logins up in PostgreSQL with auth_query, but we didn't test that here.
What it saves
We held idle connections open, each after one small query, and added up the memory actually used by the PostgreSQL and PgBouncer processes (PSS, which counts shared memory fairly). The test clients themselves aren't counted. With no clients, PostgreSQL used 72 MB.
| Clients connected | PostgreSQL connections, direct | Direct, MB | PostgreSQL connections, through PgBouncer | PgBouncer plus PostgreSQL, MB |
|---|---|---|---|---|
| 20 | 20 | 107 | 2 | 87 |
| 100 | 100 | 232 | 2 | 86 |
| 300 | 300 | 547 | 2 | 86 |
That's about 1.6 MB for each idle connection. A connection that has run real queries holds more, because of its caches, so read this as the lowest it can be. PgBouncer itself stayed at 8 to 10 MB throughout. Going direct at 300 also meant raising max_connections to 400 and restarting PostgreSQL.
What it does to speed
pgbench at scale 300 (a 4.5 GB database) on the same server, with PostgreSQL tuned as in our other guide, pool size 20. Each test ran 30 seconds, 3 times, with the order swapped each round. Before we swapped the order, the second port tested always looked better, simply because the cache was warmer.
| Test | Direct, median (range) | PgBouncer, median (range) | Change |
|---|---|---|---|
| Reads, 20 clients | 2,651 (2,228 to 4,063) | 2,712 (2,625 to 3,936) | No real change |
| Reads, 100 clients | 2,895 (2,073 to 2,954) | 2,896 (2,748 to 3,880) | No real change |
| Reads, 300 clients | 2,735 (2,675 to 2,915) | 3,170 (3,004 to 3,950) | +16% |
| Reads and writes, 20 clients | 2,251 (1,915 to 2,293) | 1,845 (1,713 to 1,910) | -18% |
| Reads, 20 clients, new connection each transaction | 169 (163 to 175) | 346 (343 to 372) | +105% |
The ranges are wide on reads, as this database is bigger than memory and our test machine is shared, so only trust the bigger gaps. The pattern is what matters: the more connections you have and the more often you open them, the more PgBouncer helps. With a few steady clients it's one more hop, and on this small server pgbench and PgBouncer were also competing with PostgreSQL for the same 2 vCPU.
Step 6: size the pool
default_pool_size is how many PostgreSQL connections each database and user pair gets. Clients over that number wait in a queue instead of failing. With 6 one-second transactions on a pool of 2, show pools showed this, and all six finished in 3.1 seconds:
Start at 20 on 2 vCPU, which handled 300 clients above. Watch cl_waiting under real load: if it stays above zero, either your transactions are too slow or the pool is too small, and fixing slow transactions usually pays more. Keep pool size times your database and user pairs below max_connections, and leave some room for direct logins.
Which of our servers can run this
All of them, every step, as everything here stays on localhost. PgBouncer's small memory use makes the most difference on servers under $20, though most apps there won't have enough connections to need it. Port 6432 isn't reachable from outside on those servers, so keep your app on the same one.
Sources
Our own runs on Ubuntu 24.04, 3 November 2026, under QEMU/KVM with kernel 6.8.0-147, disk capped at 3,000 IOPS and 150 MB/s: PgBouncer 1.26.1, PostgreSQL 18.6, pgbench at scale 300 (scale 5 for the prepared statement test). Docs: PgBouncer configuration, features by pool mode, PgBouncer usage and admin console.
Pick PostgreSQL in the installs when you order, then add PgBouncer with these steps.
See the servers