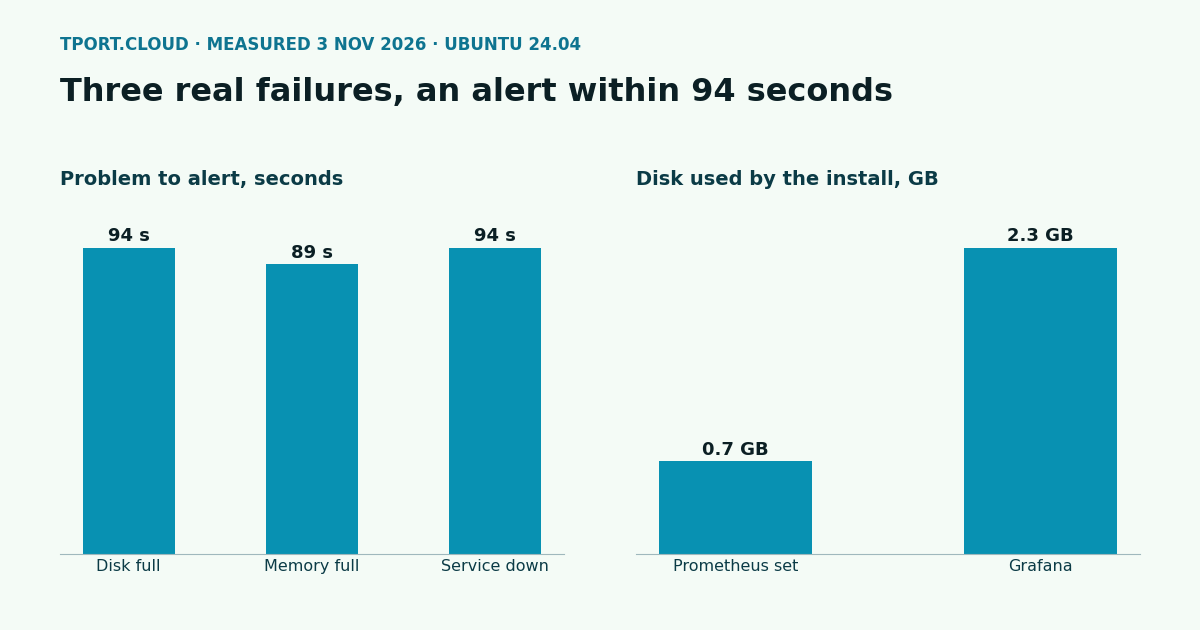
Most monitoring guides stop when the graphs appear. We filled a real disk, filled the memory and stopped a service, and each alert reached us within 94 seconds, with an all-clear 60 seconds after the fix. The same rules also taught us something we weren't expecting: on some servers the usual disk alert can't fire, and a 10% memory alert comes too late. Both are covered below, with the rules we'd use instead.
We ran every step on 3 November 2026 on a clean Ubuntu 24.04 server with 2 vCPU and 4 GB of memory, using Ubuntu's own packages for Prometheus 2.45.3, node exporter 1.7.0 and Alertmanager 0.26.0, plus Grafana 13.3.0 from Grafana's repository.
Step 1: install
That took 50 seconds and added 0.7 GB of disk. Grafana comes from its own repository. It's a big download: 397 MB, 2.3 GB of extra disk used in our run, and 17 minutes on our test connection. You can skip it if you only want alerts.
Step 2: close the ports
These packages start listening on every network address the moment they're installed: ports 9090, 9100, 9093 and 9094 were all open to any address, with no login. Metrics tell an attacker a lot about your server, so limit them to localhost:
Step 3: Prometheus and the alert rules
That's /etc/prometheus/prometheus.yml. Next, /etc/prometheus/alerts.yml. Use these thresholds on a server with its own kernel, and see the section on smaller servers below if yours is under $20:
Step 4: Alertmanager
Alertmanager sends the alerts. Write /etc/prometheus/alertmanager.yml, with your own address in url:
We tested with a small local script that wrote each webhook to a file. Alertmanager can also send to email, Slack and others with email_configs or slack_configs, but we didn't test those here, so send yourself a test alert after setting one up.
Step 5: start and check
You should see four lines, all on 127.0.0.1, and none for 9094. Then change Grafana's default password before anything else:
We checked this: afterwards admin:admin got a 401 and the new password a 200. To reach Grafana, use a tunnel instead of opening the port, then browse to http://127.0.0.1:3000:
To get graphs fast, import dashboard 1860, Node Exporter Full, under Dashboards, New, Import. It imported cleanly into 13.3.0 and showed live data through our tunnel. After a reboot, all four services came back by themselves, still on localhost only.
Step 6: prove the alerts work
Do this once on a server with nothing important on it. Here's what we did:
For memory, we ran a small program that held all but 7% of it, leaving 313 MB available out of 3,915 MB. Times below run from the start of each problem:
| Problem | Alert pending | Alert firing | Webhook received | All-clear after the fix |
|---|---|---|---|---|
| Root disk at 90% | 23 s | 84 s | 94 s | 60 s |
| Memory 92% used | 19 s | 79 s | 89 s | 60 s |
| node exporter stopped | 25 s | 84 s | 94 s | 60 s |
The delay adds up from settings you control: up to 15 seconds to scrape, up to 15 to evaluate, 60 for for: 1m and 10 for group_wait. The all-clear waits for group_interval. Shorten for if you want it faster, but you'll get more false alarms from brief spikes.
What it can't tell you
If the server itself dies, this stack can't tell you, because it dies too. That happened to us by accident: the machine hosting our test server ran out of memory and killed it, and no alert went out. For that, you need a check from outside the server, or a second Prometheus elsewhere watching this one. We didn't test either.
That crash taught us two more things. On restart, Prometheus found a damaged log file, dropped the damaged part and carried on by itself. We didn't measure how much data that lost. And after the crash, when the same service-down alert fired again, the webhook didn't arrive in the 2 minutes we waited. The most likely reason is that Alertmanager still counted it as already sent, as it never got to send the all-clear, and repeat_interval is 4 hours. Once that alert had cleared, the next test delivered normally at 94 seconds. A shorter repeat_interval narrows this gap.
What it costs to run
We sampled each service every 60 seconds for 29 minutes, with no dashboard open, on a server with nothing else to monitor. Prometheus was storing 112 new data points each second, across 4,260 series. Half an hour is a short window, and Prometheus memory grows as data builds up, so take these as starting figures. Grafana uses almost three-quarters of the memory and nearly all the CPU, even with nobody looking at it, which makes it the part to leave out on a tight server.
| Part | Memory | CPU |
|---|---|---|
| Prometheus | 62 MB | 0.23% of one core |
| node exporter | 22 MB | 0.22% |
| Alertmanager | 33 MB | 0.01% |
| Grafana, nobody viewing | 336 MB | 5.4% |
| All four | 453 MB | 5.9%, about 85 minutes of CPU a day |
Disk: new data first goes into a log and is packed into compact blocks after a few hours. At 112 points a second that's 9.7 million a day. Using the 1 to 2 bytes per point in Prometheus's documentation, that works out to about 10 to 20 MB a day, or 150 to 300 MB for the 15 days we set. That's a calculation rather than a reading, as 29 minutes is too short to reach the first compact block: the uncompacted log grew 2 MB in that time, or roughly 100 MB a day at worst. More exporters or servers raise it in proportion.
Which of our servers can run this
| Server | Works? | What to change |
|---|---|---|
| $20 a month and up | Yes, every step | Nothing. These have their own kernel, and the numbers above come from this kind of setup |
| Under $20 | Yes, but change two rules | See below. The ports are private anyway, and the Grafana tunnel goes over SSH, which is reachable |
Under $20: the disk rule never fires
We filled a server like this, with a 30 GB disk, to 29.3 GB. df still said 26% used, node exporter agreed, and DiskAlmostFull stayed silent, while a new 1 GB file was refused with Disk quota exceeded. On these servers df doesn't see your plan's limit. Measure real use instead, with node exporter's text file folder:
Then replace the disk rule's expr, putting your plan's size in place of 30:
This one fired in the same test and cleared after we removed the files. The du run took about a second. It updates every 5 minutes, so it can lag by that much.
Under $20: alert on memory at 20%, not 10%
The memory figures are correct on these servers, but there's no swap and the limit is hard. On our 4 GB test server:
| Program holding | Available | What happened |
|---|---|---|
| 3,000 MB | 25% | Fine, no alert at 10% or 20% |
| 3,450 MB | 14% | Fine. A 10% rule stayed silent. A 20% rule was firing by 90 s |
| 3,650 MB | Couldn't read | The server stopped responding to commands for about 9 minutes, until we deleted it. Nothing was killed to free memory, so it didn't recover on its own |
So a 10% rule may never get the chance to fire. Use this instead, and keep your app's memory well below the limit:
Backups go nicely with this. Our restic guide adds its own alert for failed runs.
Sources
Our own runs on Ubuntu 24.04, 3 November 2026, under QEMU/KVM with kernel 6.8, 2 vCPU, 4 GB and a 40 GB disk; memory was reduced to 2 GB for the cost sampling, after the crash above, so the test machine could fit other work. Small server tests used 2 vCPU, 4 GB, 30 GB. Docs: Prometheus storage, alerting rules, Alertmanager configuration, Grafana dashboard 1860.
Order a server, then set up your alerts before you need them.
See the servers